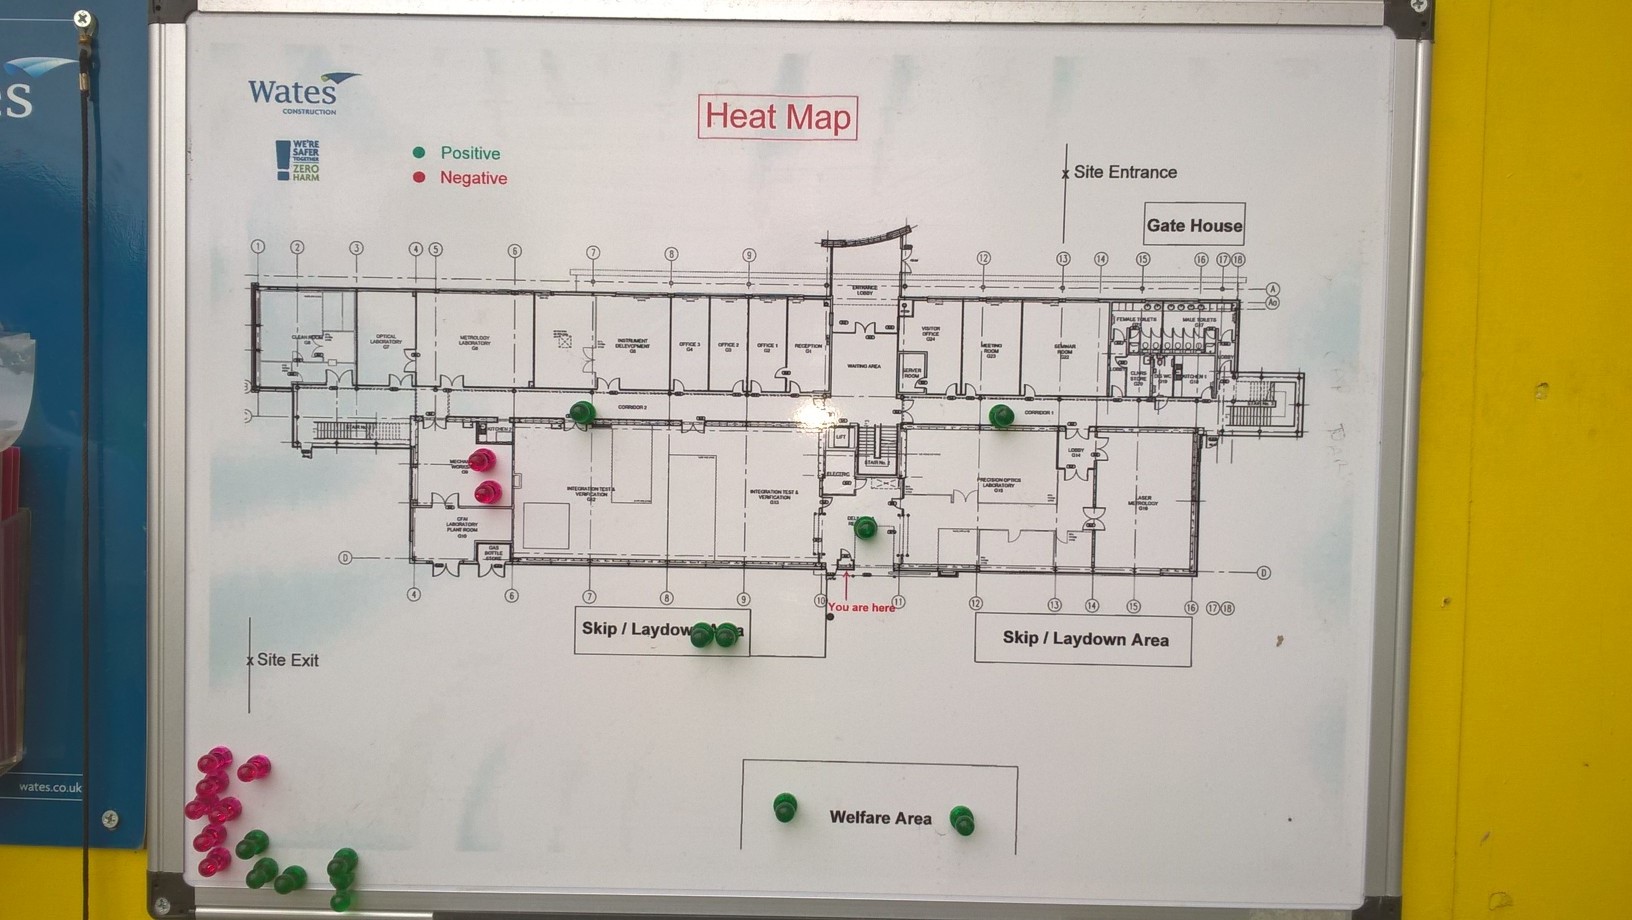
Heat Map Showing High Risk Areas

Some high risk areas can be difficult to identify.

Technology can help assist managing potential hazards and high risk areas that otherwise might be missed.

The below example shows how one site achieved this:

  • The contractor has developed a “heat map” to visually show areas where potential workplace-based risks may be expected;
  • The heat map is located at the biometric turnstile entry into the workplace area and is highly visible;
  • The heat map consists of a plan of the entire workplace superimposed onto two steel sheets, one for each floor;
  • Every day the operatives are encouraged to report potential “safety hazards” on near miss cards;
  • As these near miss cards are handed in, the site manager will attach a magnetic marker to the appropriate area on the workplace plan providing a visual representation of where these potential safety hazards lie.

To find out more, click the link below.

Go to resource


Footer Reference

Monitor report. Wates Construction Ltd. Stockton-on-Tees. October 2016


Did you find this article helpful?

Please rate this article

0 votes, average: 0.00 out of 50 votes, average: 0.00 out of 50 votes, average: 0.00 out of 50 votes, average: 0.00 out of 50 votes, average: 0.00 out of 5 (0 votes, average: 0.00 out of 5)
You need to be a registered member to rate this.
Loading...

Leave a comment

Return to previous page

The Scheme does not promote or endorse any products, goods or services. For more information, click here.

The Best Practice Hub is provided by the Considerate Constructors Scheme