Mapping Project Specific Environmental Constraints Using QGIS


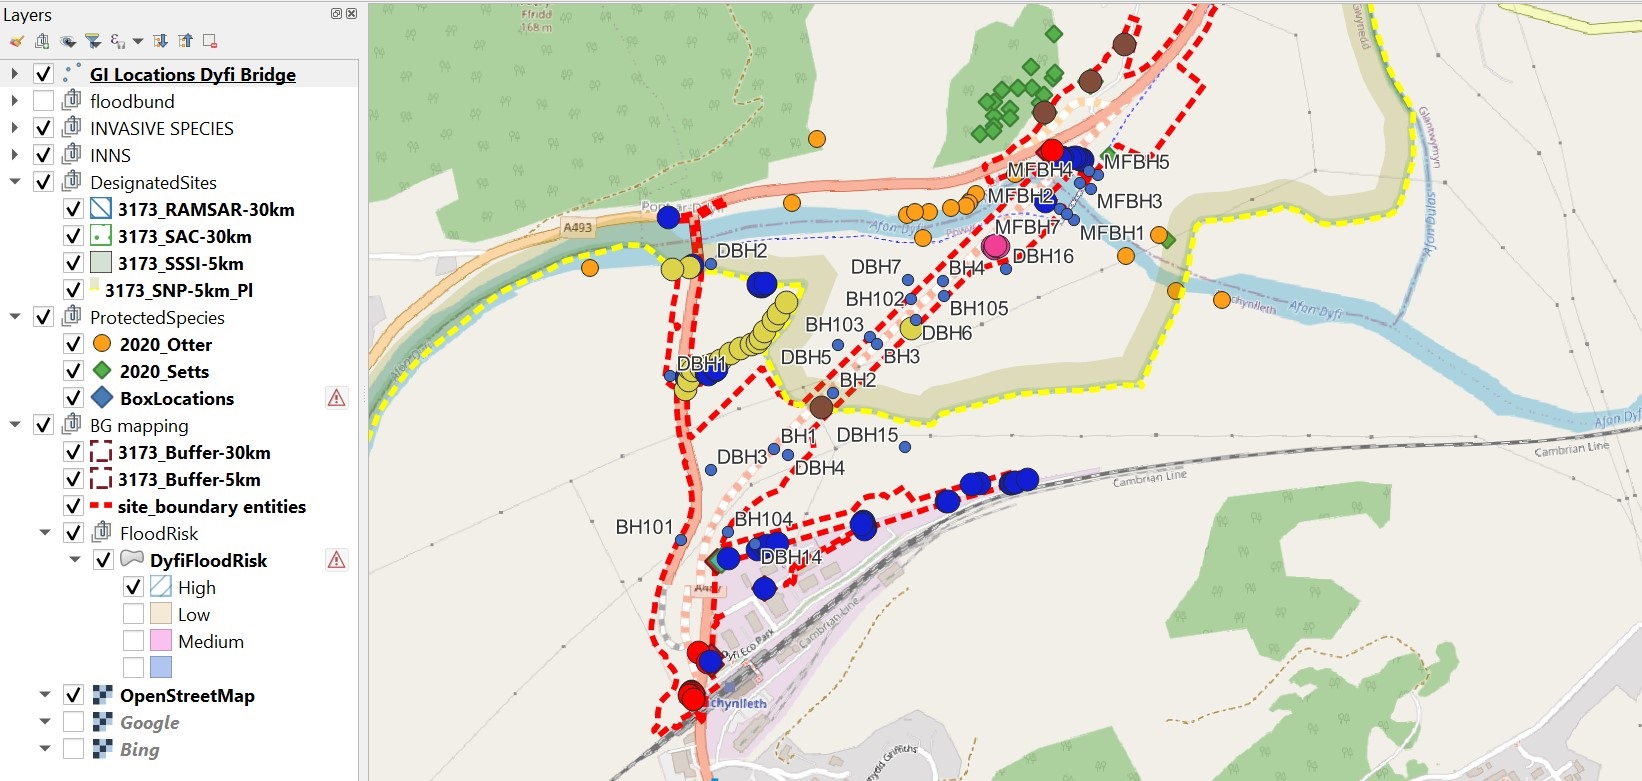
Locations of invasive plants, ground investigation boreholes, bat and doormouse boxes, underground services, site boundary, archaeological features are shown on a map which can be included in a RAMS so that the workforce can see the locations of sensitive areas in relation to their work area.
Furthermore, the map can be downloaded into QField and uploaded onto a tablet which can be taken onto site to show real time data. It also enables new data to be added, for example, a newly discovered bird nest. Warning flags can also be added, for example, ecological supervision required in this location.
Visual representation of environmental and health and safety risks can be seen instantly. It will allow such risks to be better understood by the workforce and reduce the number of errors. It will improve the environmental and health and safety performance of the project.
To find out more, click the link below.
Footer Reference
Monitor Report. Alun Griffiths (Contractors) Ltd. Wales. November 2022.
Did you find this article helpful?
Please rate this article
(1 votes, average: 5.00 out of 5)You need to be a registered member to rate this.
About this entry
About the author
Jack Endean
Partnerships and Innovations Manager
Entries by this author 998
View all entries by Jack Endean
Company Information
Considerate Constructors Scheme
http://www.ccsbestpractice.org.uk
The Scheme does not promote or endorse any products, goods or services. For more information, click here.