Technical Interface Reporting Dashboard

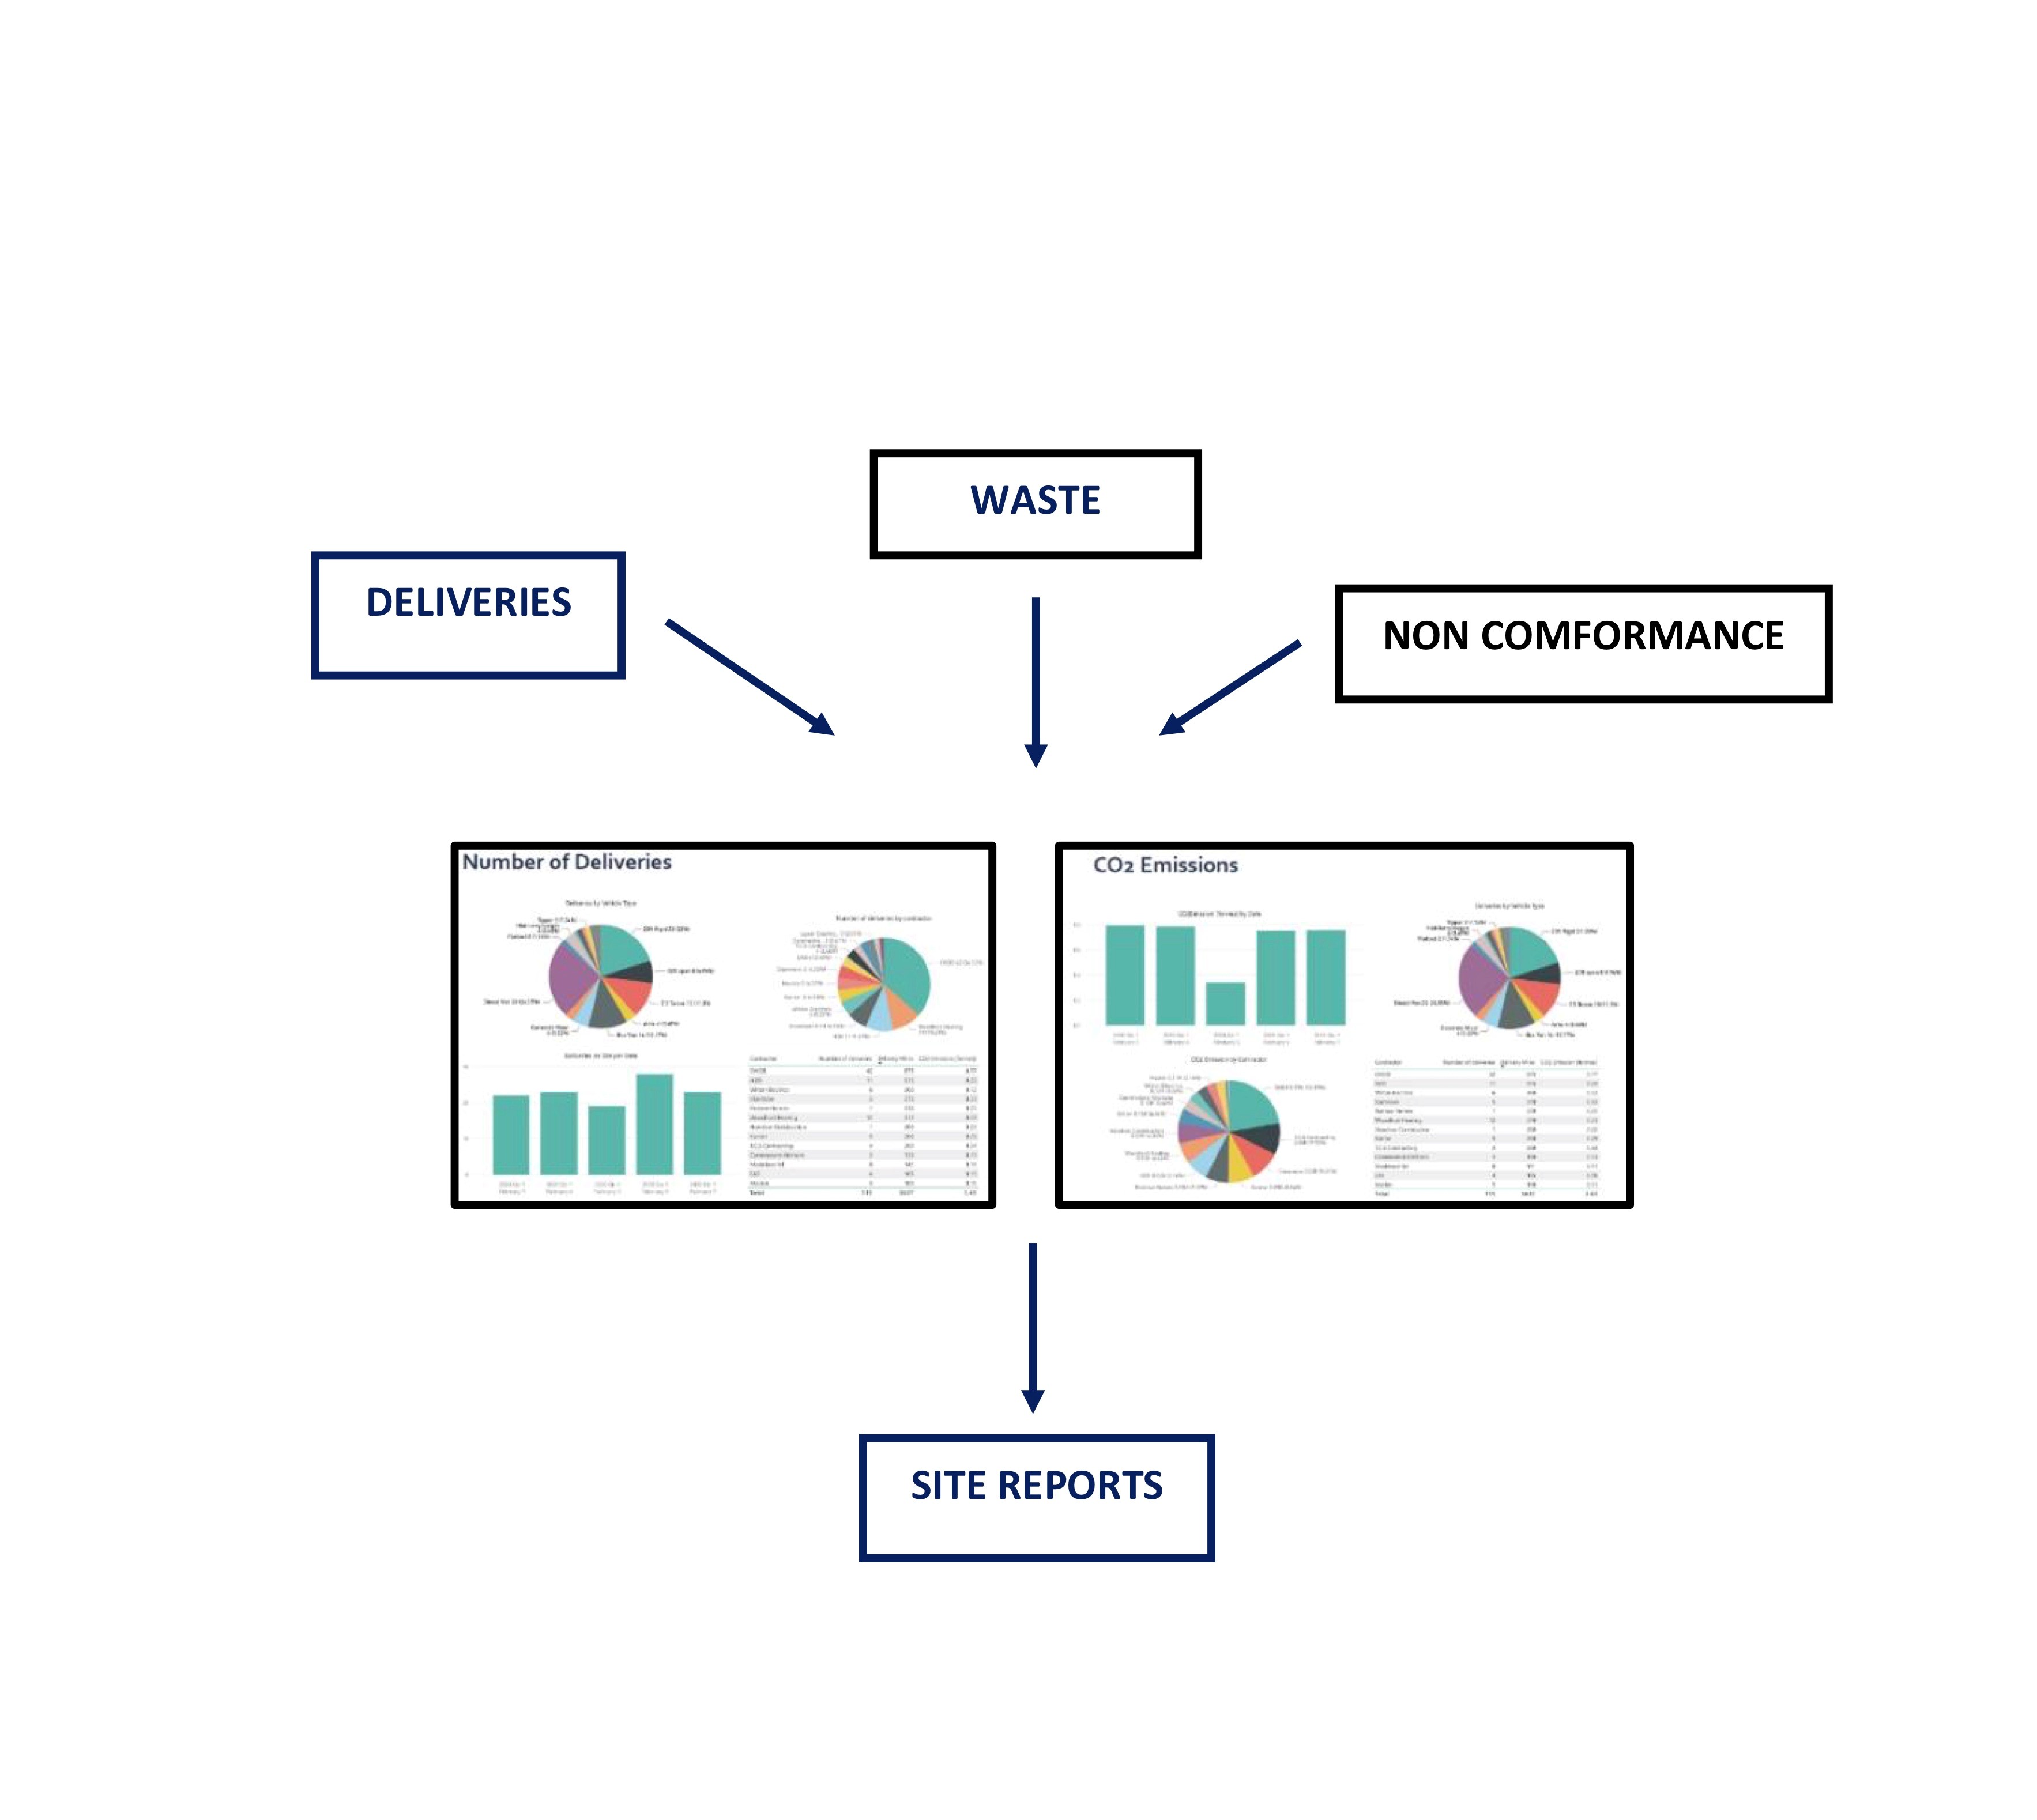
This contractors newly designed dashboard brings together Datasets from third parties, client led software and their own software to create a full report that is then indexed, formatted and exported into different formats. Their I.T Manager created a new platform using PowerBi which brings all the information into one single dashboard that they can create many reports from.
This platform brings across information from all their projects into one very informative report. This report means they have full visibility of ‘actual’ movements from every project every second of the day.
As a logistic specialist it’s important they have all of their digital platforms consolidated into one quickly accessible report for their Clients, Senior Leadership Team, and Site Team to ensure they have up to date information at all times. This enables complete compliance with their client’s requirements and assists with the sustainability of the project.
Footer Reference
Monitor Report. Focus Group Logistics. London. May 2022.
Did you find this article helpful?
Please rate this article
 (0 votes, average: 0.00 out of 5)
You need to be a registered member to rate this.
About this entry
About the author
Jack Endean
Partnerships and Innovations Manager
Entries by this author 998
View all entries by Jack Endean
Company Information
Considerate Constructors Scheme
http://www.ccsbestpractice.org.uk
The Scheme does not promote or endorse any products, goods or services. For more information, click here.